Thermal loads
This example input file represents a single household user whose only
load is the “shower”. The example showcases how to model thermal loads
by: 1) using a time-varying average power attribute, pre-calculated
as a function of the average daily groundwater temperature; and 2) using
the thermal_p_var attribute to add further variability to the actual
power absorbed by the appliance in each usage event, which reflects the
randomness of user behaviour in preferring a slightly warmer or colder
shower temperature.
# importing functions
from ramp import User, UseCase, load_data, get_day_type
import pandas as pd
Creating a user category and appliances
household = User()
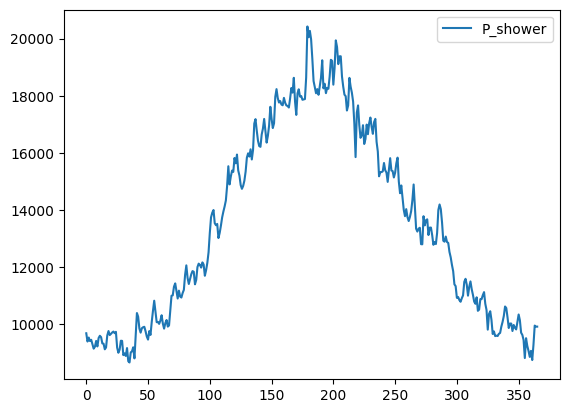
When the power varies across days of the year, for instance, as a
function of the average daily groundwater temperature, the “power”
parameter can be passed as a pd.DataFrame or np.array with a
daily profile (365 rows of data). For this exercise, data can be loaded
from the default examples in ramp:
shower_power = load_data(example="shower")
# shower power distribution
shower_power.plot()
<Axes: >

shower = household.add_appliance(
    name="Shower",
    number=1,
    power=shower_power,
    num_windows=2,
    func_time=15,
    time_fraction_random_variability=0.1,
    func_cycle=3,
    window_1=[390, 540],
    window_2=[1080, 1200],
    random_var_w=0.2,
)
Generating profiles for increasing degrees of thermal_p_var
usecase = UseCase(users=[household], date_start="2020-01-01")
usecase.initialize(num_days=365)
You will simulate 365 day(s) from 2020-01-01 00:00:00 until 2020-12-31 00:00:00
def thermal_p_var_sensitivity(values):
    # buidling a pd.DataFrame for saving sensitivity results
    results = pd.DataFrame(
        index=pd.date_range(start="2020-01-01", periods=1440 * 365, freq="T"),
        columns=[f"p_var = {value}" for value in values],
    )

    for value in values:
        # changing the thermal_P_var
        shower.thermal_p_var = value

        profiles = usecase.generate_daily_load_profiles(flat=True)

        # assigning the yearly profile for a given sensitivity case
        results[f"p_var = {value}"] = profiles

    return results
sensitivity_results = thermal_p_var_sensitivity([0, 0.25, 0.5, 0.75, 1])
sensitivity_results
| p_var = 0 | p_var = 0.25 | p_var = 0.5 | p_var = 0.75 | p_var = 1 | |
|---|---|---|---|---|---|
| 2020-01-01 00:00:00 | 0.0 | 0.0 | 0.0 | 0.0 | 0.0 |
| 2020-01-01 00:01:00 | 0.0 | 0.0 | 0.0 | 0.0 | 0.0 |
| 2020-01-01 00:02:00 | 0.0 | 0.0 | 0.0 | 0.0 | 0.0 |
| 2020-01-01 00:03:00 | 0.0 | 0.0 | 0.0 | 0.0 | 0.0 |
| 2020-01-01 00:04:00 | 0.0 | 0.0 | 0.0 | 0.0 | 0.0 |
| ... | ... | ... | ... | ... | ... |
| 2020-12-30 23:55:00 | 0.0 | 0.0 | 0.0 | 0.0 | 0.0 |
| 2020-12-30 23:56:00 | 0.0 | 0.0 | 0.0 | 0.0 | 0.0 |
| 2020-12-30 23:57:00 | 0.0 | 0.0 | 0.0 | 0.0 | 0.0 |
| 2020-12-30 23:58:00 | 0.0 | 0.0 | 0.0 | 0.0 | 0.0 |
| 2020-12-30 23:59:00 | 0.0 | 0.0 | 0.0 | 0.0 | 0.0 |
525600 rows × 5 columns
# showing the daily average of the load profiles
average_daily_profiles = sensitivity_results.resample("1d").mean()
average_daily_profiles.plot()
<Axes: >

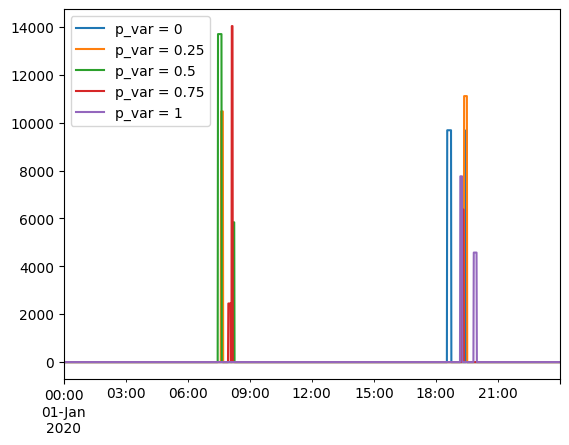
first_day = pd.date_range(
    start="2020-01-01 00:00:00", freq="1min", periods=24 * 60  # a full day
)
sensitivity_results.loc[first_day].plot()
<Axes: >
