Using tabular inputs to build a model
When the number of users or appliances is high, it can be difficult to
create a model using Python scripts. Therefore, RAMP allows you to
create inputs in tabular format (.xlsx). On the other hand, it is
still possible to use Python to generate a large tabular file with
default parameter values, which can then be more easily customised. In
this example, we show a possible utilisation of this functionality.
from ramp import User, Appliance, UseCase, get_day_type
import pandas as pd
As a first step, one must create User classes and assign
Appliances to the user class without assigning detailed appliance
characteristics. Hence, users and their appliances are added to a
UseCase.
Building a tabular file populated with default data
# Defining a dict of users with their appliances

user_app = {"household": ["light", "tv"], "school": ["light", "computer"]}
# creating a UseCase class to create the database
use_case = UseCase()
# assinging the appliances to users
for user, apps in user_app.items():
    user_instance = User(user_name=user)

    for app in apps:
        app_instance = user_instance.add_appliance(name=app)
        app_instance.windows()

    use_case.add_user(user_instance)
/home/fl/GitHub-repos/RAMP/ramp/core/core.py:1198: UserWarning: No windows is declared, default window of 24 hours is selected
  warnings.warn(
Once the Users and Appliances are added to the use_case
instance, the model user can get a pd.DataFrame or an .xlsx file
of all the data with the default values.
Exporting the database
# getting the dataframe
use_case.export_to_dataframe()
| user_name | num_users | user_preference | name | number | power | num_windows | func_time | time_fraction_random_variability | func_cycle | ... | cw32_start | cw32_end | r_c3 | window_1_start | window_1_end | window_2_start | window_2_end | window_3_start | window_3_end | random_var_w | |
|---|---|---|---|---|---|---|---|---|---|---|---|---|---|---|---|---|---|---|---|---|---|
| 0 | household | 1 | 0 | light | 1 | 0.0 | 1 | 0 | 0 | 1 | ... | 0 | 0 | 0 | 0 | 1440 | 0 | 0 | 0 | 0 | 0 |
| 1 | household | 1 | 0 | tv | 1 | 0.0 | 1 | 0 | 0 | 1 | ... | 0 | 0 | 0 | 0 | 1440 | 0 | 0 | 0 | 0 | 0 |
| 2 | school | 1 | 0 | light | 1 | 0.0 | 1 | 0 | 0 | 1 | ... | 0 | 0 | 0 | 0 | 1440 | 0 | 0 | 0 | 0 | 0 |
| 3 | school | 1 | 0 | computer | 1 | 0.0 | 1 | 0 | 0 | 1 | ... | 0 | 0 | 0 | 0 | 1440 | 0 | 0 | 0 | 0 | 0 |
4 rows × 51 columns
# Printing out the database to an .xlsx file
use_case.save("example_excel_usecase")
Once the function is used, an .xlsx file will be created in the
given path. Now, you can easily fill out the information in the
.xlsx file and load the data into the model database as detailed
below.
Loading the database
# loading data

use_case = UseCase()  # creating a new UseCase instance
use_case.load("example_excel_usecase_filled.xlsx")
Generating load profiles
Once the database is loaded, the user can continue with the normal analysis, for instance, generating aggregated profiles
n_days = 30
date_start = "2020-01-01"
use_case.date_start = date_start
use_case.initialize(num_days=n_days, force=True)
use_case.generate_daily_load_profiles()
You will simulate 30 day(s) from 2020-01-01 00:00:00 until 2020-01-31 00:00:00
array([0. , 0. , 0. , ..., 0.002, 0.002, 0.002])
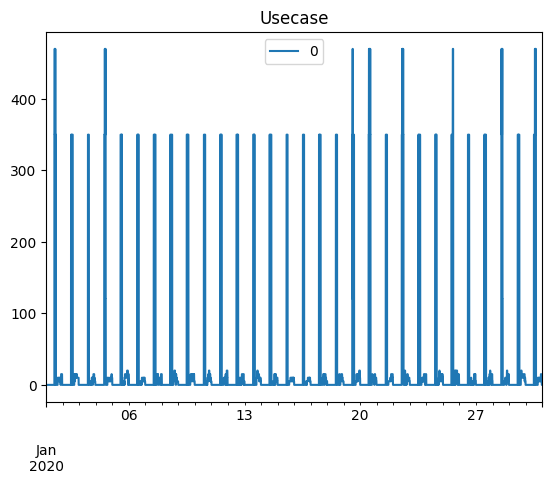
profiles = pd.DataFrame(
    data=use_case.generate_daily_load_profiles(flat=True),
    index=pd.date_range(start=date_start, periods=1440 * n_days, freq="T"),
)

profiles.plot(title="Usecase")
<Axes: title={'center': 'Usecase'}>
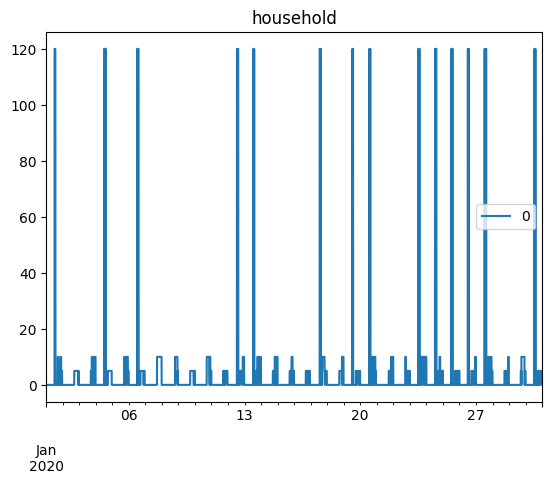
Generating load profiles for the single users of the usecase
for user in use_case.users:
    user_profiles = []
    for day_idx, day in enumerate(use_case.days):
        profile = user.generate_aggregated_load_profile(
            prof_i=day_idx,
            peak_time_range=use_case.peak_time_range,
            day_type=get_day_type(day),
        )

        user_profiles.extend(profile)

    profiles = pd.DataFrame(
        data=user_profiles,
        index=pd.date_range(start=date_start, periods=1440 * n_days, freq="T"),
    )

    profiles.plot(title=user.user_name)